As we all know there are many indicators for option trading but here are the best indicator for option trading for your trading journey.
First of all, here is a brief introduction to Options Trading:
Options trading is a type of investment strategy that involves buying and selling options contracts on various financial instruments, such as stocks, indices, commodities, or currencies. Options are derivative instruments that give the holder the right, but not the obligation, to buy or sell an underlying asset at a predetermined price (strike price) within a specified period (expiration date).
There are two types of options: calls and puts.
CALL OPTION: A call option gives the holder the right to buy the underlying asset at the strike price.
PUT OPTION: A put option gives the holder the right to sell the underlying asset at the strike price.
Traders can use options to speculate on the underlying asset’s price movement, hedge their existing positions, or generate income through various options trading strategies.
When trading options, traders can take either a long position (buying options) or a short position (selling options). Buying options provides the opportunity for potential gains if the price of the underlying asset moves in the anticipated direction.
However, the risk is limited to the premium paid for the option. On the other hand, selling options involves taking on the obligation to fulfill the terms of the contract if the option is exercised, which carries higher risk but can offer the potential to earn premium income.
Option trading provides several advantages, including leverage, flexibility, and the ability to profit in both rising and falling markets. With options, traders can control a larger position in the underlying asset for a fraction of the cost compared to buying or selling the asset outright.
Options also offer flexibility regarding the trading strategies that can be employed, such as buying or selling options with different strike prices or expiration dates.
It’s important to note that options trading involves risks and requires a good understanding of the market and the specific risks associated with options. It’s recommended to educate yourself on options trading strategies, risk management techniques, and market analysis before engaging in options trading. Consulting with a financial advisor or experienced options trader can also be beneficial when starting out.
Here is the best indicator for option trading:
1. VWAP: A Powerful Tool for Option Trading Success
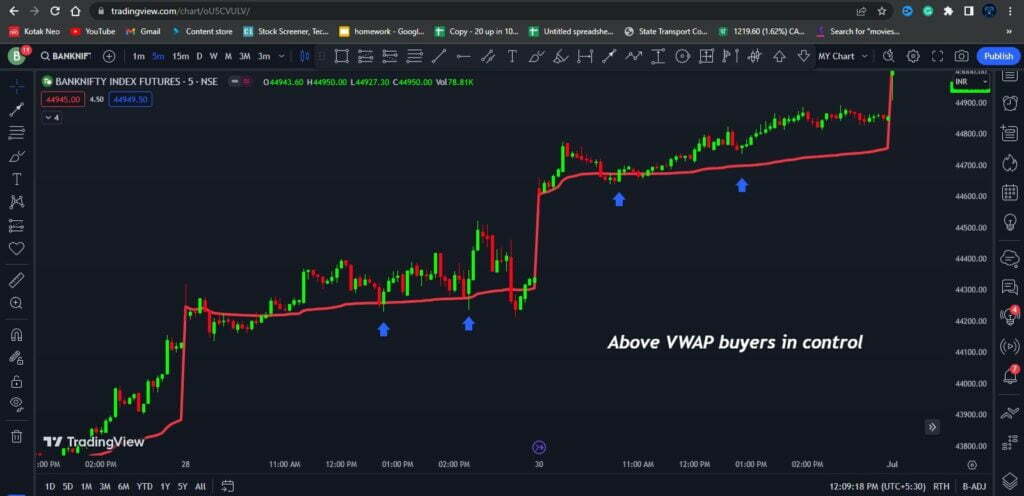
VOLUME WEIGHTED AVERAGE PRICE ( VWAP) is the cumulative average price of a stock traded during one day and many big traders consider this as the best indicator for option trading.
The calculation of the VWAP begins the moment the market opens, builds throughout the day, and concludes at the close of the session the daily VWAP resets at the start of each new day. So this is the best option trading indicator you guys can use in intraday trading.
Here you guys can see Below VWAP Sellers in control.

Here you guys can see Above VWAP Buyers in control.
WHY VWAP?
The VWAP was a benchmark to measure whether an institutional customer received a fair execution of their order by the broker who bought or sold a stock on their behalf. The difference between the reported price of a trade to the institutional customer and the VWAP let the customer objectively determine if their broker did a fair job in the execution of their order.
For more information about VWAP (read this article): BEST VWAP ARTICLE
2. Moving Average: Riding the Trend Waves in Option Trading
So moving averages are the most commonly found technical indicator on charts because of their simple efficiency in displaying trends.
The purpose of a moving average is to smooth out the often volatile and erratic price activity to reduce market “ noise” and allow for easy and objective recognition of Trends.
Note that because there are both minor and major trends in any given timeframe, it is common to use more than one moving average.
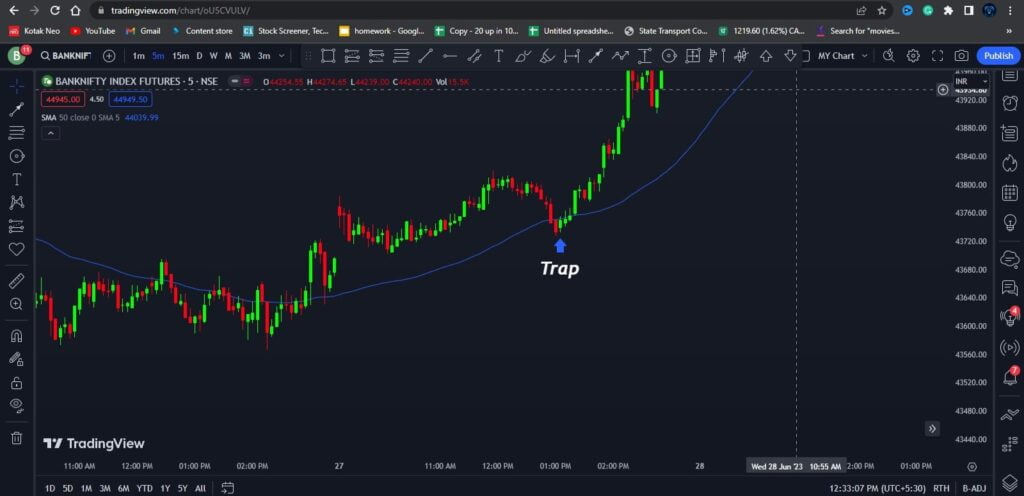
Always Remember the direction of the key moving average is more important than a close above or below them.
READ THIS ARTICLE: Best Moving Average
Example: Here moving average is rising but you guys can see the candle closes below the moving average this is clearly a TRAP
How To Use Moving Average:
Always use moving averages as a trend identification tool don’t just blindly sell or buy near moving averages.
When the moving average is rising don’t need short or sell try to find out the buy-side position for more probability of winning.

The moving average is declining don’t need to buy try to find out the sell-side position for more probability of winning.

3. RSI: The Key to Identifying Optimal Entry and Exit Points in Options
The Relative Strength Index (RSI) is a popular technical indicator used by traders and investors to assess the strength and momentum of price movements in financial markets. It is primarily used in analyzing stock prices, but it can also be applied to other assets such as commodities, currencies, or indices.

The RSI is a bounded oscillator that ranges between 0 and 100 and is typically displayed as a line chart. The indicator calculates the ratio of upward price changes to downward price changes over a specified period, usually 14 periods, and presents it as a single value on a scale from 0 to 100.
The RSI is based on the concept that when an asset’s price moves too far and too fast in one direction, it may be due for a reversal or correction. It helps traders identify overbought or oversold conditions in the market, indicating potential trend exhaustion or upcoming price reversals.
The RSI generates signals based on two primary levels: 70 and 30. When the RSI rises above 70, the asset may be overbought, indicating a potential reversal or a price pullback. and when the RSI drops below 30, the asset may be oversold, indicating a potential price bounce or an upcoming reversal to the upside.

Traders often look for divergences between price action and the RSI to identify potential trend reversals.
For example, if an asset’s price makes a new high while the RSI fails to reach a new high (bearish divergence), it may indicate weakening bullish momentum and a potential reversal to the downside. Conversely, if an asset’s price makes a new low while the RSI fails to reach a new low (bullish divergence), it may suggest weakening bearish momentum and a potential reversal to the upside.
It’s important to note that the RSI is just one tool among many in technical analysis and should not be used in isolation. Traders often combine the RSI with other indicators, such as moving averages or trend lines, to confirm signals and make more informed trading decisions.
CONCLUSION:
There is nothing like the Best indicator for option trading always remember whatever works for you is the best indicator for option trading for you don’t just blindly trust anybody always backtest and then use any kind of strategy which works for you. So I hope you like this article.
Read more articles: click here
Best indicators for options trading: click here
FAQ
Best indicator for option trading?
1. Vwap
2. Moving Average
3. RSI
What is the moving average?
Trend identification tool (potentially acts as support and resistance)
VWAP Full Form?
Volume weighted average Price
RSI Full Form?
Relative Strength Index
3 thoughts on “Best Indicator For Option Trading”