Best moving average crossover For 5 min chart, best settings, intraday moving average and full explanation how to use moving average properly all topics will be covered in this article.
So First of all here is a brief introduction to Moving average :
Moving averages are the most commonly found technical indicator on charts because of their simple efficiency in displaying trends.
The purpose of a moving average is to smooth out the noise of the market and the main objective of a moving average is to identify the main trend of any market.
Note that because there are both minor and major trends in any given timeframe, it is common to use more than one moving average.
In this article, you guys will see a different approach to moving averages with this approach you guys can make more precise decisions for your trading.
What are the best moving average crossover settings?
In reality, there is nothing like the best moving average crossover settings. instead of finding the best moving average crossover settings try to find out what moving average works for you. For me I use 20,50 and 200 Ma on daily timeframe.
But, the most commonly used moving average are 10,20,50 and 200 and there are many kinds of moving average combinations used by many traders.
What is the success rate of the moving average crossover?
The success rate of the moving average is very less if you blindly trust any crossover, Instead of crossover I will teach you one method which will increase your success rate in the moving average
First of all, I don’t like crossovers because crossovers give late entry into any market whether it is the stock market or the forex market.
How to properly use moving average whether you are using 5 min, 15 min, or any timeframe?
Why I hate crossovers Let’s see

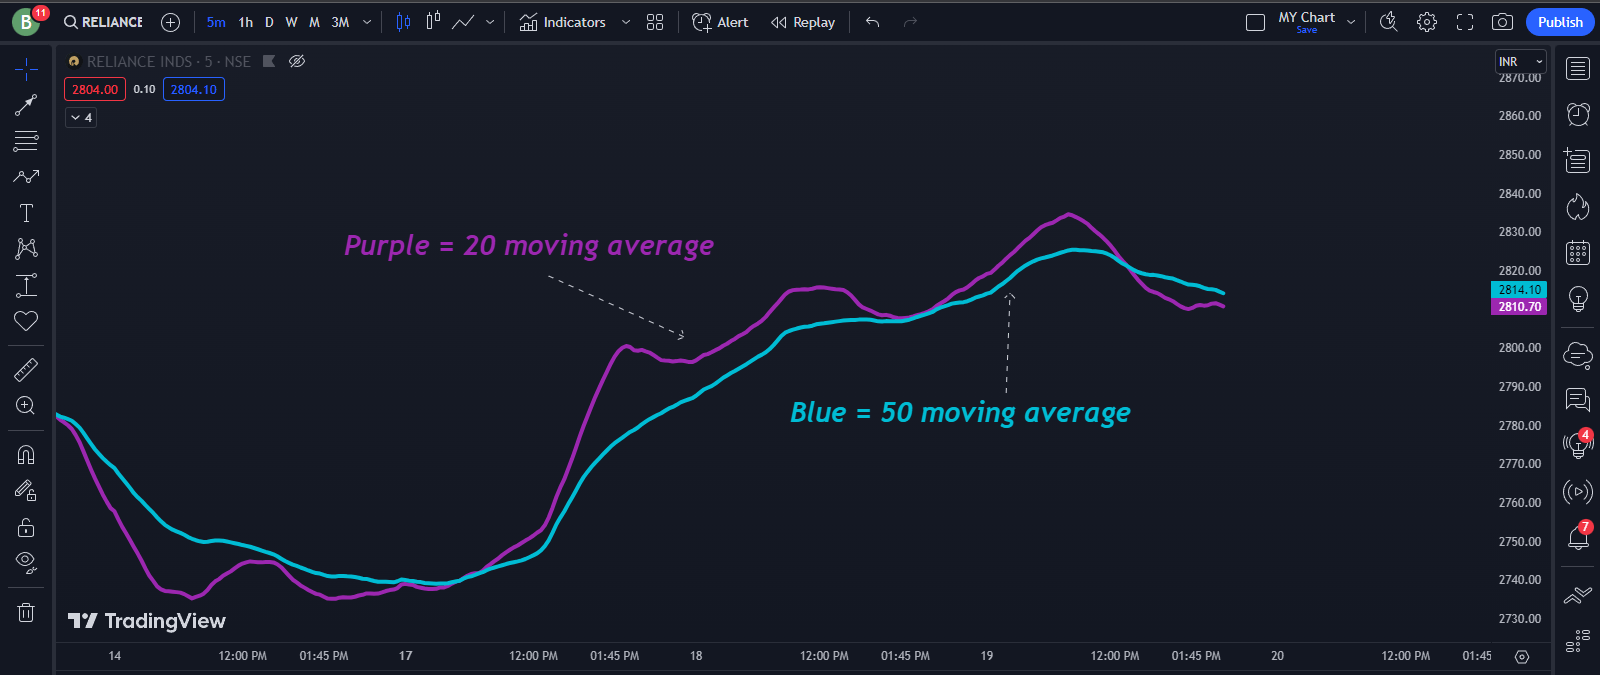
Here is a chart of Reliance industry you guys can see stock already UP by 64% before crossover so thats why i hate crossover beacuse crossover give very late entry.
Instead of using moving average for crossovers you guys can use moving average as trend indentification tool and don’t take entries on random crossover for your BUY and SELL.
Let me show you how you guys can use moving average:
RULES
First of all I am using 20 and 50 moving average on 5 min timeframe.

Moving averages
Always consider bigger Picture for any stock
Here, Bigger picture is on Bullish Side.

Uptrend
Don’t BUY if the 50 moving average is in the decline phase because most of the rallies will fail under the declining 50 moving average.
Example 1:

So you guys can clearly see 50 moving average is in declining phase and rally toward 50 moving average is failed. let me show you one more example so you guys can trust .This time i will use daily timeframe with 50 day moving average.
Here White Box represent rally towards 50 day moving average.
Example 2:

So That’s why don’t buy under 50 day moving average specially when 50 day moving average is in decline phase.
Don’t SELL if 50 day moving average is in advancing phase( upside) because most of the Short side rallies will fail above advancing 50 day moving average.
Example 1:

So you guys can clearly see 50 moving average is in Advancing phase and short rallies towards 50 moving average is failed.
Let me show you one more example:

50 MA Advancing
You guys can clearly see 50 day moving average is in Advancing phase and short rallies towards 50 moving average is failed and here you guys can see few closes below 50 day moving average but you don’t have to sell because 50 day moving average is in advancing phase.
For me : I use 20 moving average as my Trailing stoploss
So this is a proper way to use Moving Average as a trend indentification tool and You guys can use this information on any timeframe with this approach you guys can increase you success rate in moving average concept.
Best moving average for intraday?
Here are some moving average you guys can use in your intraday trading:
50 Moving Average : This moving average tells you overall trend for that particular timeframe.
20 Moving Average : This moving average tells you to trail your stoploss for that particular timeframe.
9 Moving average : If you really want to trial your stoploss tightly then use this moving average.
Conclusion:
There is nothing like best moving average crossover for 5 min chart just do whatever works for you. Don’t take random trades on the basis of moving average crossover because we don’t want to participate too late in any trade.
Always ask 2 questions before entring in trade:
Where it has come from ?
Where does it have the potential to go ? ( Risk-Reward)
MORE INFORMATION:
Also Read best indicator for option trading : Click Here
FAQ
Best moving average for intraday ?
9,20 and 50 MA
MA means ?
Moving average
EMA means
Exponential movinga average
What is the success rate of the moving average crossover?
If you just randomly trade crossover then success rate is very Low.

3 thoughts on “Best Moving Average Crossover For 5 Min Chart”